Google Universal Analytics: Sunset & Data Deletion
As you may know, Google Analytics 4 (GA4) completely replaced Google Universal Analytics (UA) as of July 1, 2023. Those of you on Google Analytics 4 have been running it for over a year now.
The old data from Google UA could not be imported to GA4. You could only preserve the old data for the past year or download reports.
Uh Oh! Google is Deleting Old Universal Analytics
Google is now sunsetting the old Universal Analytics data. Your old data in the Universal Analytics account will be deleted forever. If you want data from 2023 and prior, you must actively download it prior to July 1, 2024.
“Starting the week of July 1, 2024: You won’t be able to access any Universal Analytics properties or the API (not even with read-only access), and all data will be deleted. While the standard sunset took weeks to complete, the full Universal Analytics shutdown will happen within a week. We know your data is important to you, and we recommend that you export your previously processed data before this date.” – Google Analytics
If you want your old Google Universal Analytics data, you must download it in the next 30 days.
How to Export Your Data
If you want to maintain this data, you will need to export it in one of three ways:
- Export individual reports into the following formats:
- CSV
- TSV
- TSV for Excel
- Excel (XLSX)
- Google Sheets
- Use the Google Analytics Reporting API to export data to Cloud storage and connect to Looker Studio. Learn more about available dimensions and metrics, APIs, and API quotas. Note that coding skills are required. There are some plug-and-play services to transfer your archived data to a new service, but it is still not a straightforward process and requires time to learn and set up.
- Install the Google Sheets add-on for Analytics and follow these instructions to archive your data, which will allow you to export aggregated reports on demand, including historical data.
Next Steps
If you have not looked at your data in the past year, then you may not need to worry about this at all. All data since the time you converted to Google Analytics 4 is stored and available.
Google Analytics 4 came online in 2020. Most clients updated in 2021, 2022, or by mid-2023 at the latest. So, most likely, you have at least the last year’s data, if not several years of historical data.
But maybe you want your last ten years of analytics? If so, keep reading, as there are a few options.
Export the Reports Manually
One of the easiest methods is exporting which reports you need. You can login to Google Universal Analytics and click on “Export” at the top right to download the reports you want to maintain.
You can choose from PDF, Google Sheets, Excel (XLSX), or CSV. Our recommendation is either Google Sheets or Excel. It depends if you want the data on Google Drive or locally on your computer. We also recommend PDFs for just the overview reports so the line chart is included to show overall trendlines.
It should take no more than one to two hours to export the reports from prior years but depends on how long you have been tracking. The last 10 years should be more than sufficient.
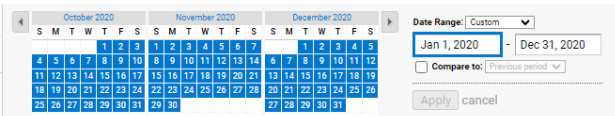
Navigate to the reports you want and set the appropriate date range. We recommend setting the date range (at the top right) to a yearly basis for each report you want.
Export reports for the following four main areas and any important sub reports. The date should not change between reports for each year.
- Audience – Overview
- Acquisition – Overview
- Behavior – Overview
- Conversion – Goals > Overview
Once complete, switch the date range to a prior year and export each report again. It is tedious, but faster and less expensive than learning the API code and setting up a new data transfer service.
If you want to collect more detailed data, we recommend checking out these other reports:
- Behavior > All Pages (filter for top 1000 pages)
- Behavior > Landing Pages (filter for top 1000 pages)
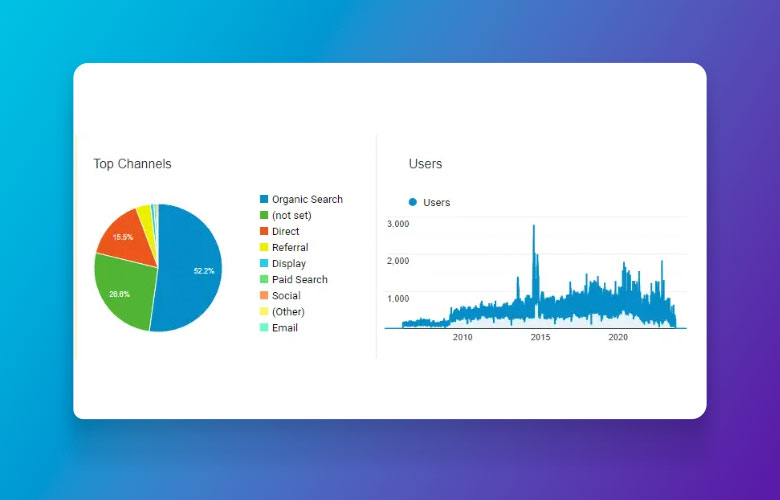
- Acquisition > All Traffic > Channels (you can do per channel too, if you wish)
- Acquisition > All Traffic > Source/Medium
- Audience > Mobile > Overview
- …and there are many other reports you could export, too.
I Want an Oompa-Loompa …. Err Data, Now!
If you need to channel your inner Veruca Salt, then you can get everything you want now. If you want to maintain all the data, then you will need to set up the reporting API or Google Sheets add-on. These are more in-depth articles, and you would need to follow the procedures step-by-step. Here is a great guide on the possible options by Coupler.IO, which is a data plugin service that can sync Universal Analytics to various spreadsheets and databases.
Need Help?
If you need assistance with any of the above, please let us know. Our team at PaperStreet is happy to help.
Please note that we will work at our hourly rate to assist you in downloading and setting up API or Google add-ons to preserve your data. We will need at least a few hours to finalize everything for your firm.
About Us
Did you know more than 200 clients have worked with PaperStreet for more than 10 years?
Get a Free Website
Analysis and Consultation
Marketing Services